|
Liquidity Ratios |
Measuring liquidity |
|
There are two fundamental measures of liquidity that can be derived immediately from the balance sheet.
|
|

|
|
|
The first of these ratios monitors the ability of the company to pay, and the second the general efficiency of the production cycle.
|
|
|
What is the difference between the two ratios?
|
|
|
The quick ratio, also called the Acid test, is a measure of how effectively a company can meet its immediate liabilities. The debtors represent near cash — they are presumably just about to pay up. So immediate liabilities can be met from this source, and, of course, cash.
|
|
|
The current ratio also includes stock items of raw materials, work in progress and finished goods. The company hopes to convert all of these into cash in the short run, but this depends on continuing sales, and is not so certain, nor is the money immediately available for payment of debts.
|
|
|
What might be the optimum ratios?
|
|
|
Here the general principle is that you can only really tell what is a good ratio for a business by knowing the business well.
|
|
|
Whether a liquidity crisis is immanent of not can best be predicted from comparing the ratios from differing periods.
|
|
|
If the liquidity ratio is worsening — determined by comparing, for example, accounts on a month by month basis — then a liquidity crisis may be developing, and action may be necessary.
|
|
|
However, there are some general rules of thumb.
|
|
|
For the acid test the idea is the obvious one that you need about as much cash and near cash as you have debts. This means that an optimum ratio for the acid test is 1.
|
|
|
The amount of money tied up in stocks should be kept to a minimum. A rule of thumb is that the current asset ratio should be between 1.5 and 2.0.
|
|
|
Suppose in a manufacturing company the acid test = 1 and the current asset ratio =1.2. Why kind of problem would this indicate — if any?
|
|
|
The acid test gives an appropriate ratio of 1, so the company, other things being equal, is not facing an immediate inability to pay its debts. So a liquidity crisis in that sense is not forecast.
|
|
|
On the other hands, stocks are being held at only 20% of liabilities. Unless this company is ultra-efficient, this low level suggests that stocks of raw materials or finished products and both are in danger of being depleted in the production chain, and that could mean that production could have to halt at some time. There is enough cash to meet debts, but a break down in the smooth running of production is a possibility.
|
|
|
However, it is just possible that the company does not require large stocks, so the final conclusion could only be derived from a closer knowledge of the company.
|
|
|
Suppose in a manufacturing company the acid test = 1, and the current asset ratio — 4. Would this be a problem?
|
|
|
The company is able to meet its debts. However, the large current asset ratio suggests that the company has too much money tied up in stocks. It might also suggest that there are large stocks being held of finished products which the company is not managing to sell. The cause could be anything but the large current asset ratio suggests either production inefficiency or a failure of marketing.
|
|
General conclusion about the liquidity ratios |
|
The acid test gives a warning of an immanent cash flow crisis. A rule of thumb is
|
|
|
Acid test = 1
|
|
|
which indicates that the company has just about as much cash and near cash as it has bills to pay.
|
|
|
The current asset ratio acts as an indicator of efficiency, and warns when production is about to break down through insufficient assets passing through the production line, or alternatively, it is an indicator of a failure of profitability through inefficient use of resources or a failure of marketing. A rule of thumb is:
|
|
|
1.5 < Acid Test < 2.0
|
|
|
which indicates that the company has neither too much, nor too little stocks.
|
|
|
Questions
|
|
|
1. What are liquid assets? What is near cash?
|
|
|
Liquid assets are things like cash and near cash. By “near cash” we mean anything that can be converted to cash in the short run. For example, debtors are near cash, because they are expected to pay up shortly and this means they will provide cash for the business.
|
|
|
2. What is a failure of liquidity?
|
|
|
This is when you run out of cash or credit to pay your bills.
|
|
|
3. Why do debtors represent near cash?
|
|
|
This dealt with in answer to question (1). Debtors are expected to pay shortly and so their debt will be converted to cash.
|
|
|
4. What is the danger in keeping working capital to a minimum?
|
|
|
You might run out of something that is vital to the running of the business — for example, you might run out of photocopying paper if you keep your stocks of photocopying paper to a minimum.
|
|
|
5. Why might an optimum ratio for the acid test be 1?
|
|
|
This basically says that it is about right to have as much cash and debtors (cash and very near cash) as you have current liabilities (that is, mainly bills to pay). That seems intuitively about right!
|
|
|
We examine the use of the liquidity ratios through worked examples. These examples build on and require a knowledge of the profitability ratios.
|
|
Example (1) |
|
Rather Nice Bookcases Limited
|
|
|
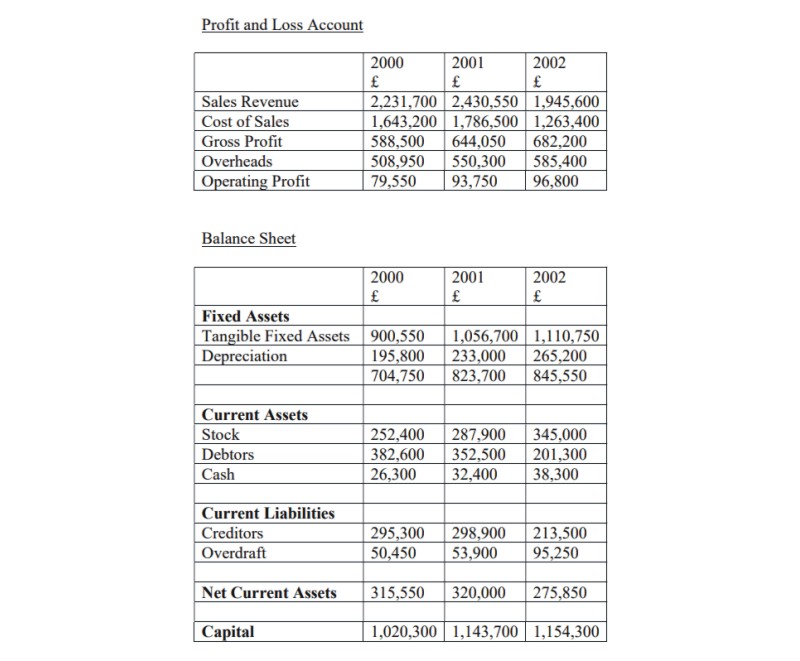
Examine the following balances drawn from the accounts of Rather Nice Bookcases Limited. Calculate the profitability ratios: return on capital employed, profit/sales and sales/capital employed. Examine the trends in these ratios.
|
|
|
Calculate also the liquidity ratios, current and quick, and comment on the liquidity of the firm.
|
|
|
Make recommendations to the Directors.
|
|
|
Profit and Loss Account
|
|
|
|
|
Hint 1
|
|
|
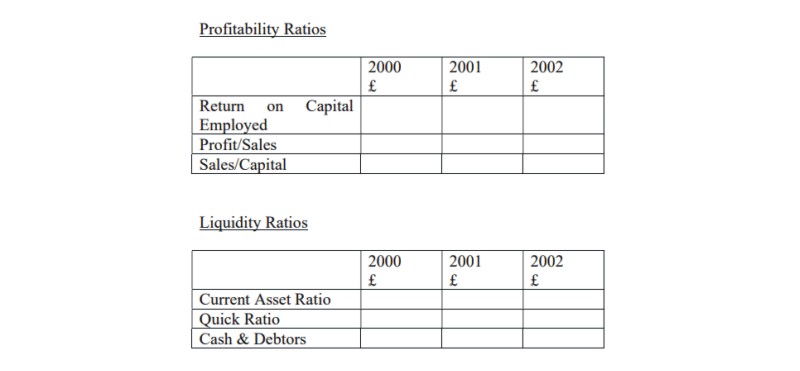
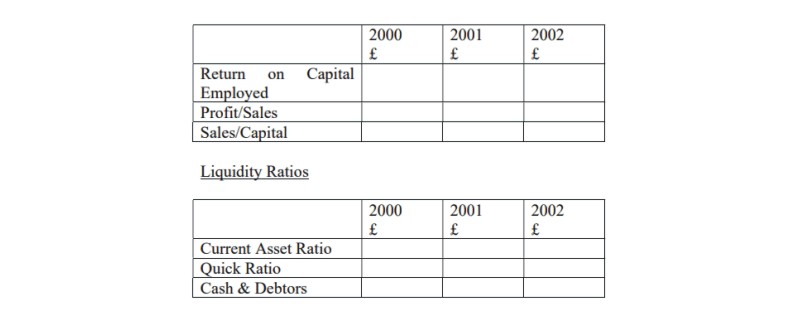
Fill in the missing values for the profitability and liquidity ratios.
|
|
|
Figures for the cash & debtors will also help the analysis.
|
|
|
|
|
What follows are the answers to the first hint, and a second hint.
|
|
|
Hint 2
|
|
|
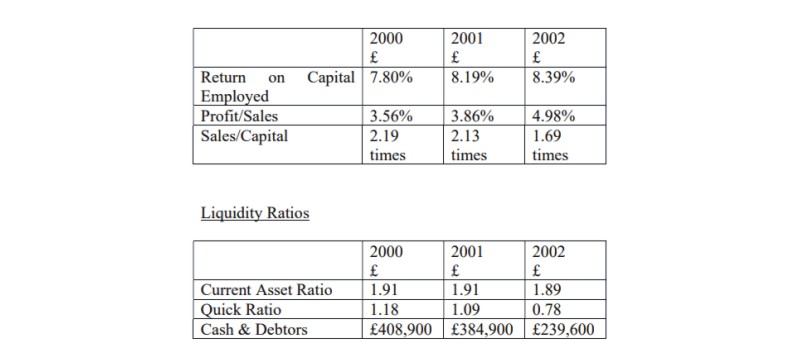
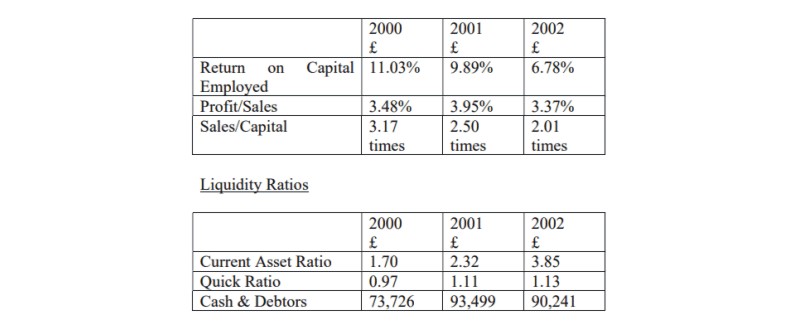
Here are the results of the calculations
|
|
|
Profitability Ratios
|
|
|
|
|
Consider these questions, and then write a report about the trends shown in these accounts.
|
|
| 1 | | What is happening to profitability? |
| 2 | | What is happening to the quick ratio? Is this a problem? |
| 3 | | What is happening to the level of cash and debtors? |
| 4 | | Why is the current asset ratio fairly constant? Examine trends in stocks. |
| 5 | | Examine trends in profit/sales and sales/capital employed. What extra information do these provide? |
| 6 | | What is happening to sales revenue? |
|
|
|
What follows is the answer to this question.
|
|
|
Solution
|
|
|
Profitability Ratios
|
|
|
|
|
|
Report
|
|
|
The company is profitable but is facing an immanent liquidity crisis.
|
|
|
Return on Capital Employed has been improving steadily. This is largely attributable to steady improvements in the profit/sales ratio, indicating increasing production efficiency. This conclusion is also supported by the steady current ratio, which suggests that raw materials are flowing through the production line in a smooth way.
|
|
|
Unfortunately, 2002 has seen a collapse of sales, and the quick ratio has fallen to a dangerously low figure of 0.78. We may assume that a quick ratio of 1.09 is acceptable for this firm, and it is close the “rule of thumb” optimum of 1.00. However, 0.78 is probably not a tolerable level of cash liquidity, and closer examination of the figures reveals an increasing overdraft, which will make the bank suspicious if they are approached for further funds. The crisis is looming because there has been a fall in the number of debtors, indicating decreased orders, and stocks are simply piling up, which is inefficient in itself.
|
|
|
It is not clear what radical action the company can take. Plunges in sales can occur for all sorts of reasons, especially as all businesses are to some extent dependent on movements in the economy as a whole. But this company has not been attending to detail during the years of prosperity, and has allowed overheads to creep up steadily. The difference between the 1994 and 1996 figure of approximately Ł70,00 is cahs that is sorely missed now. With it, the company might shoulder the crisis, without it, it looks as if those rather nice bookcases will be appearing as discounted items in furniture shops up and down the country as the liquidators seek to recover as much of the assets as possible.
|
|
Example (2) |
|
Soft Toys Manufacturing Limited
|
|
|
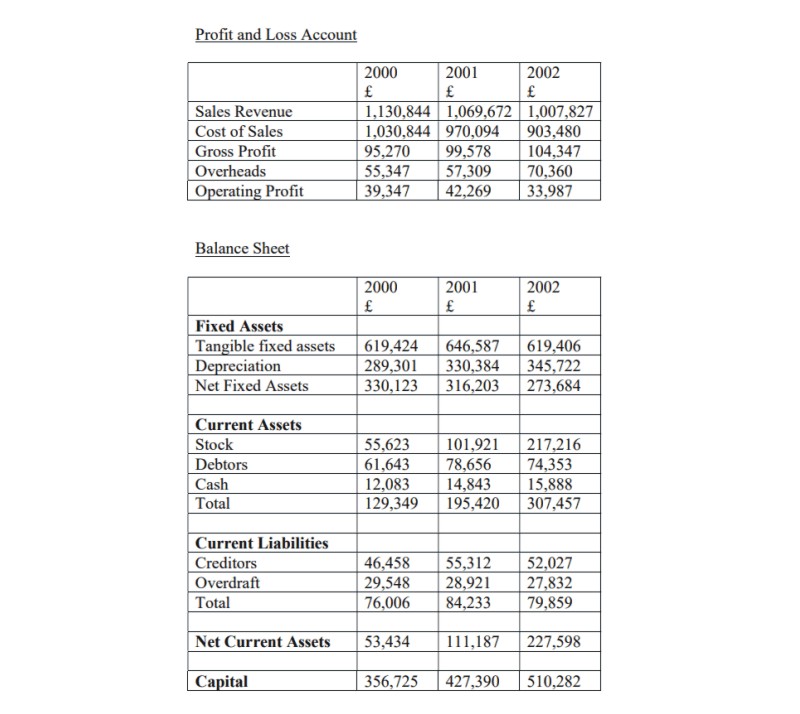
Examine the following figures drawn from the accounts of a fictitious company. Calculate the profitability ratios — return on capital employed, profit/sales and sales/capital employed. Examine trends in these ratios.
|
|
|
Calculate also the liquidity ratios, current and quick, and comment on the liquidity of the firm.
|
|
|
Make recommendations to the Directors.
|
|
|
Profit and Loss Account
|
|
|
|
|
What follows is a hint
|
|
|
Hint
|
|
|
Fill in the missing blanks in the following tables, examine trends, and try to imagine a story to explain them.
|
|
|
Profitability Ratios
|
|
|
|
|
The answer to the hint and a report on the company follow.
|
|
|
Solution
|
|
|
Profitability Ratios
|
|
|
|
|
This company is facing no immanent cash flow crisis, and has even achieved a modest reduction of its overdraft over the past three years, but the analysis indicates some serious underlying problems.
|
|
|
Two indicators of alarm are the decline return on capital employed and the rising asset ratio.
|
|
|
The rising asset ratio is clear due to an enormous increase in the stocks held. This is a toy manufacturing company, and the rise in stocks suggest the company is unable to sell its product. This also accounts for the terrible decline in the sales from capital employed ratio.
|
|
|
This suggests that there has been a change in consumer preferences and the company has not responded. Rather than develop new products the company has gone on producing the old products at the same level, and stockpiling useless items. The stock may not be worth what it is recorded at, since items that cannot be sold have no value at all. So the increase in the capital of the company is problem not a genuine increase.
|
|
|
The possible cost of keeping and managing larger stocks than necessary is now appearing as an increase in the overheads, and there is a sharp decline in the profit from sales ratio.
|
|
|
There have been profits, and these ought to have been reinvested in new products and production methods. There is no indication that this has taken place. The “investment” has been in stocks, and the opportunity represented by these retained profits has been lost. The company is likely to be driven out of business by its competitors.
|
|
|
The company has been investing only modestly in fixed assets, and the large figures for depreciation suggest that many of these assets are old. If this is old machinery, the company will not be a leader in production efficiency.
|
|
|
All in all, the figures indicate that in 2000 the company was doing well. Two years later a rather bad situation has developed.
|
|