|
Profitability Ratios |
Ratios to examine profitability |
|
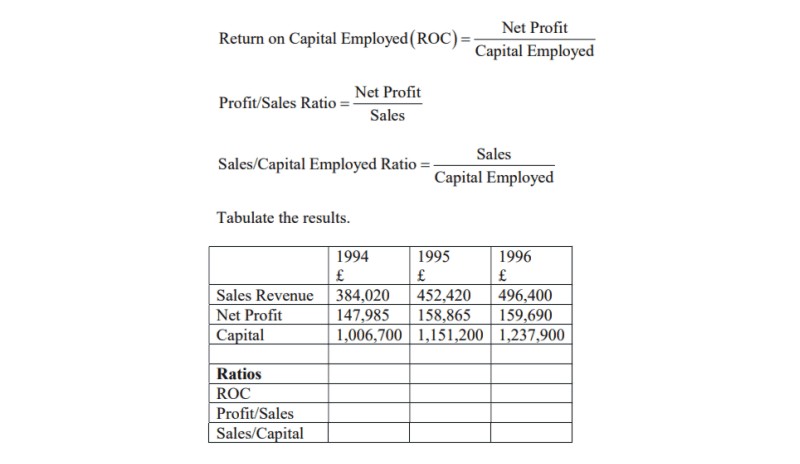
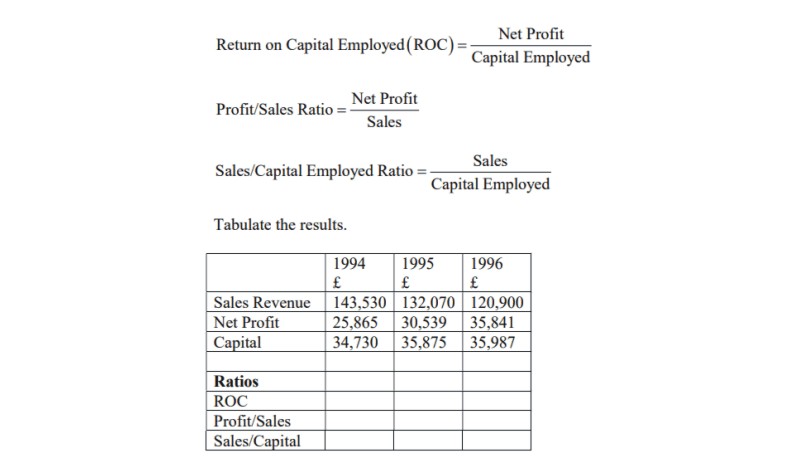
The fundamental profitability ratio is:
|
|

|
|
|
Return on Capital Employed is expressed as a ratio, which here is a number between 0 and 1. It is equally valid to express it as a percentage. Recall that to convert to a percentage, just multiply by 100.
|
|
|
Both Net Profit and Capital Employed can be derived from the company accounts. Net profit can be extracted from the Profit and Loss Account. Capital Employed is found from the Balance Sheet.
|
|
|
Profitability can be further analysed by looking at how profit arises from two activities.
|
|
| 1 | | The ability of the company to generate sales from capital |
| 2 | | The ability of the company to generate profit from sales |
|
|
|
Measures of these two ratios can indicate whether the company is performing well or badly.
|
|
|
Hence we define:
|
|

|
|
|
This enables us to see return on capital employed as the product of these two ratios.
|
|

|
|
|
We will explore the meaning of the profitability ratios by looking at worked examples.
|
|
|
Local Jewellery Limited
|
|
|
Examine the following figures drawn from accounts of Local Jewellery Limited and calculate the profitability ratios for Return on Capital Employed, Profit/Sales and Sales/Capital Employed. Examine trends in these ratios, and make recommendations to the Board.
|
|

|
|
|
Hint 1
|
|
|
Substitute the relevant numbers into the three equations
|
|
|
|
|
Consider the significance of the trends.
|
|
|
Answers to this hint and a second hint follow.
|
|
|
Hint 2
|
|
|
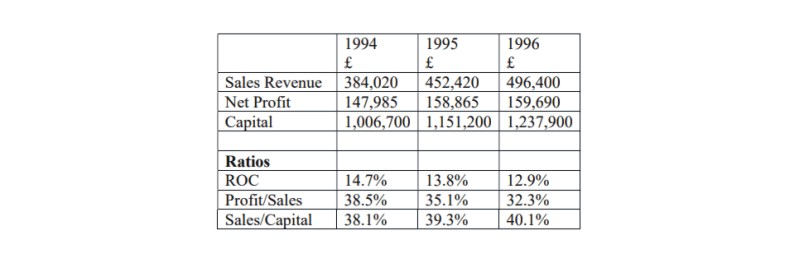
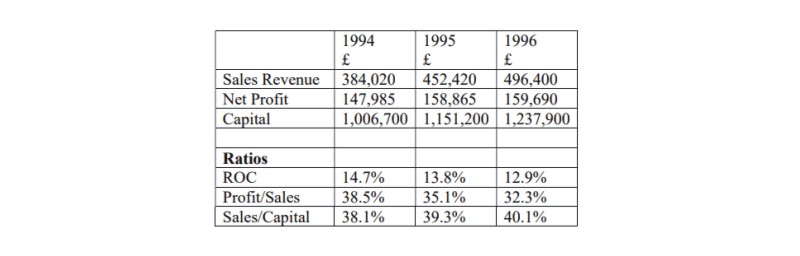
The tabulated results are
|
|
|
|
|
Now try to answer these questions, which require you to look at trends in the figures.
|
|
| 1 | | What do you notice about the trend in the Return on Capital Employed? |
| 2 | | What do you notice about the trends in the Profit/Sales and the Sales/Capital Employed? |
| 3 | | What has been happening to the total capital of the company? |
| 4 | | Can you offer any plausible explanations for these trends?
|
|
|
|
Once you have these answers, you can write a short report about what the figures mean. The answer and report follow.
|
|
|
Solution
|
|
|
|
|
Despite the modest increases in profit and even better increases in sales revenue, there has been a decline in the return on capital employed.
|
|
|
The Sales/Capital ratio indicates that the company is doing well in marketing its products.
|
|
|
The decline in profitability is attributable to a decline in the profit/sales ratio. This is in spite of continuing investment by the company.
|
|
|
Without an intimate knowledge of the company it is not possible to say for certain whether these figures do represent a developing problem within the company. The company may have been forced to increase sales by lowering price. This could happen as a result of aggressive competition, and would reduce profit margins.
|
|
|
If there is an internal problem, then without looking further at the Balance Sheet, it would not be possible to identify the actual source of inefficiency, but some kind of inefficiency seems to be creeping into the company's production system. The expansion of the company in terms of sales may be introducing diseconomies of scale. The administration may be overexpanding and bureaucratic procedures introduced. Alternatively, the company may not be investing in long term capital items at all, and may be building up unnecessary piles of stocks. Further analysis of liquidity would be required to discover the cause.
|
|
|
A Second example follows.
|
|
|
Project Management Consultancy Limited
|
|
|
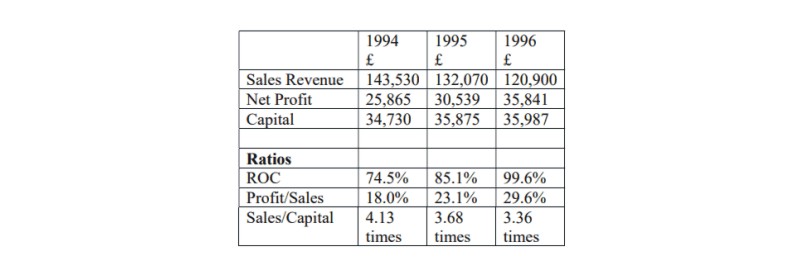
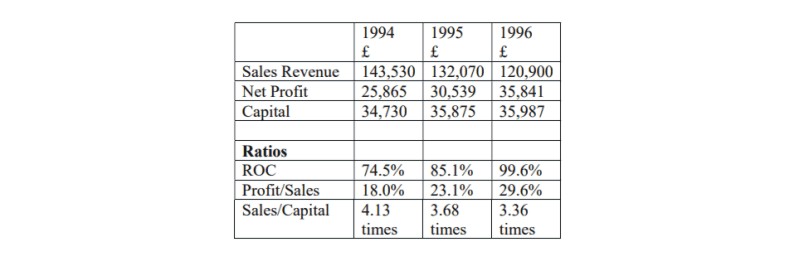
Examine the following figures drawn from accounts of Project Management Consultancy Limited and calculate the profitability ratios for Return on Capital Employed, Profit/Sales and Sales/Capital Employed. Examine trends in these ratios, and make recommendations to the Directors.
|
|
|
|
|

|
|
|
Hint 1
|
|
|
Substitute the relevant numbers into the three equations
|
|
|
|
|
Consider the significance of the trends.
|
|
|
Hint 2
|
|
|
|
| 1 | | What has happened to the return on capital employed? |
| 2 | | What has happened to the total sales revenue? Why is this surprising?
|
| 3 | | What is the trend in the Profit/Sales ratio?
|
| 4 | | What is the trend in the Sales/Capital Employed ratio?
|
| 5 | | Is this company doing well, or badly?
|
|
|
|
The solution follows.
|
|
|
Solution
|
|
|
|
|
This is a small firm operating on a relatively small capital. The obvious pint is that in percentage terms the company is very profitable. Being small, one would want to know more about the particular circumstances — are the Directors taking drawings from the company?
|
|
|
So the appearance of increased profitability may arise from the ways in which the directors are remunerating themselves for their efforts. Presumably the directors are also the chief workers in so small a company.
|
|
|
On the other hand, what is interesting is the improved efficiency in the company over the three years. It would appear that some hard thinking has gone on about the importance of turnover. Although sales (turnover) is down, what matters is profit is up, and the profit/sales ratio indicates that this is coming from improvements in the way the company is producing its consultancy service.
|
|
|
As a company works at a certain type of job, they become more experienced. Experience improves efficiency.
|
|
Other profitability ratios |
|
There are other ratios calculated that show trends in profitability.
|
|

|
|
|
Generally, businesses require a gross profit margin of at least 20% in order to cover overheads. The ratio can fall owing to (1) the inability of the company to pass on cost increases to customers; (2) losses of stock; (3) changes in the mix of sales in favour of lower priced goods; (4) attempts to increase market share by keeping prices down.
|
|

|
|
|
This the amount of profit added to the cost of goods sold.
|
|

|
|
|
This indicates the percentage of net profits generated from sales. Since it excludes interest payments it shows the operational efficiency of the business without reference to the means by which the business is financed.
|
|