|
Social Inequality |
Social stratification |
|
Social inequality can be analysed in terms of three factors
|
|
| 1 | | Power, which means the extent to which one individual or group can impose their will over another individual or group without that individual or group's consent. |
| 2 | | Prestige, which means the extent to which individuals or groups are esteemed, honoured or respected by the rest of society. |
| 3 | | Wealth, which means the extent of an individual or group's possessions, including land, property, commodities, cash, bank deposits, shares, stocks, bonds and any other form of security. |
|
|
|
Marxists believe that power and prestige are dependent on wealth, so effectively the only prime form of social inequality is wealth. However, others disagree.
|
|
|
A system of social stratification is a system whereby individuals and groups are distinguished according to the amount of power, prestige and wealth that they control. It is normal to differentiate between two different types of system of social stratification — those that are closed and those that are open. There may be degrees of closure. A closed system is one in which positions of power, prestige and wealth are purely inherited, and no movement between the social groups is possible. In a closed system the power, prestige and wealth of an individual in society is ascribed, meaning, determined at birth by inheritance. Individuals have very limited scope for altering their social position, and there is very limited social mobility. In open systems an individual's social position is achieved, that is, won by the individual as a result of his/her efforts and personal qualities. The term life chances refers to the chances an individual has of obtaining those things that are desirable, and avoiding those things that are undesirable.
|
|
|
The Hindu system is a closed system of social stratification. Hindu society is by tradition divided into five strata. The top four are called castes (varnas); the bottom stratum is a group known as the outcastes, the untouchables. The castes are in turn subdivided into subcastes (jatis), of which there are thousands. These are occupational groups. Each caste is ranked in order of ritual purity. The highest caste is the Brahmins, who are priests. They are believed to embody purity and are regarded as the sources of truth. Their tasks are to perform sacred rituals. Brahmins held the highest position within the system of social stratification — the economy was rural and they were the largest landowners, with the greatest power and prestige, including the power to form and administer the law.
|
|
|
A system of social stratification creates a hierarchy of groups. Society is divided into distinguishable groups, each with a common identity, similar attitudes and ways of living. However, it is argued that in Western post-industrial societies there is no hierarchy of groups anymore, and that distinct social classes have been replaced by a continuous hierarchy of unequal positions, in which each individual occupies a unique position, and prestige and power are continuously differentiated. Such a hierarchy is also called a hierarchy of individuals.
|
|
|
However, the other view, namely that there is a hierarchy of groups, persists, and proponents of this view also argue that the sub-groups, or sub-strata, within society have distinct subcultures — that is, norms and patterns of living that distinguish them from other social groups. Each stratum with a distinctive subculture develops a group identity.
|
|
|
Some people regard social inequality as being determined by biological differences between people. Jean-Jacque Rousseau defines biologically based inequality as “a difference of age, health, bodily strength, and the qualities of the mind or the soul.” However, very few sociologists, including Rousseau, regard social inequality as being biologically determined, and argue instead for socially created inequality. In addition, the meaning of biologically differences is also largely created by society, rather than the other way around. For example, the status of old age is different in different societies. In the West, the elderly are usually pensioned off and their status falls; but in other traditional societies, old age is accompanied by increasing power and prestige. So the biological difference of old age is only a social difference because society deems it to be so.
|
|
Income |
|
Income is related to life-chances. The higher your income, the more likely it is that you will end up owning your house, even if you did not inherit it. Thus, if differences of income were being eroded, this would provide a strong indication that economic class divisions were weakening.
|
|
|
There are several ways of measuring income
|
|
| 1 | | Original income includes sources of earned income, such as wages, salaries and pensions, and unearned income, that is, income from investments. However, income from benefits such as state pensions, family credit and income support are not included. |
| 2 | | Gross income comprises all sources of income, that is original income plus income from benefits.
|
| 3 | | Disposable income is gross income less income tax and national insurance contributions.
|
| 4 | | Post-tax income is disposable income less indirect taxation. Indirect taxation is taxation on expenditure in the form of VAT. |
| 5 | | Final income is post-income tax plus the value of benefits provided by the state, such as education and medical care. |
|
|
|
A progressive tax is one that increases with income. Progressive taxes redistribute income from the rich to the poor. The transfers of income from one group to another are called transfer payments. A regressive tax is one that taxes poor people more as a proportion of their income than rich people. Income tax is a progressive tax. VAT is an indirect tax paid on the purchase of goods. VAT tends to be mildly regressive in its effect. Thus, if income tax is reduced and VAT is increased, this has the effect of making the taxation system more regressive, not less.
|
|
Wealth |
|
The definition of wealth is subject to controversy. In official statistics there is a distinction between marketable and non-marketable wealth.
|
|
|
Marketable wealth incorporates every kind of asset that can be bought and sold, such as personal property, shares, bank savings, real estate (less the value of outstanding mortgages), but not including occupational pensions that cannot be sold.
|
|
|
Non-marketable wealth includes sources of income that cannot be bought and sold, such as salaries and pensions.
|
|
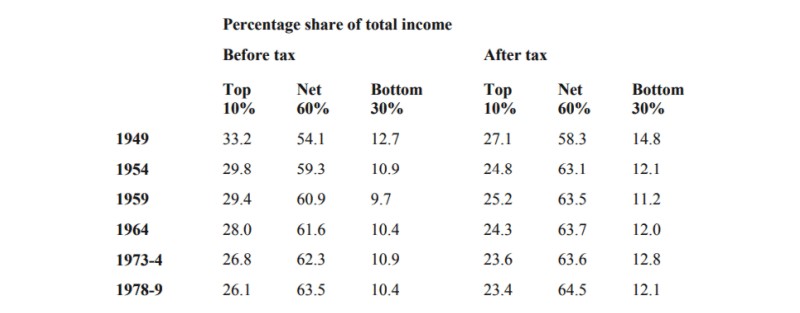
Incomes in the UK |
|
Figures for percentage share of total income, 1949-1978/9 for the United Kingdom
|
|
|
|
|
Source: A.B. Atkinson, The Economics of Inequality, OUP, 1983
|
|
|
During the Thatcher era in Britain, the basic rate of income tax was cut in a series of steps from 33% in 1979 to 25% by 1988. The highest rate of income tax was cut from 80% to 40% during the same period. A new lower rate was introduced at 20% on the first £2,000 of taxable income in 1992, and increased to £3,000 in 1994. During this period, VAT was increased. Prior to 1979 there were two rates of 8% and 12.5%; in 1979 these were replaced by a single rate of 15%, and in 1991 VAT was raised to 17.5%
|
|
|
The effect of these measures was to reverse the trend towards the redistribution of income prior to 1979. Changes in the taxation system meant that between 1976 and 1986 the final income of the top 20% of income earners increased from 37.9% to 41.7%, and the share of the bottom 20% fell from 7.4% to 5.9%. So the rich have got richer and the poor poorer as a result of changes to the system of taxation in Britain from 1979 onwards. The bottom 50% of income earners in Britain saw their tax burden increase during this period; and the top 50% of income earners in Britain saw their tax burden decrease during this period.
|
|
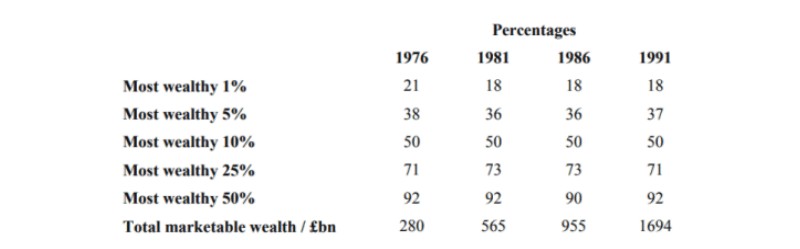
The distribution of wealth in the United Kingdom |
|
The distribution of marketable wealth in the UK between 1976 and 1991
|
|
|
|
|
The percentages are based on the population aged 18 and above
|
|
|
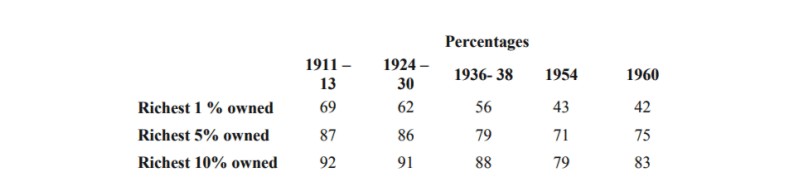
The distribution of private property from 1911 to 1960
|
|
|
|
|
The statistics show (a) that even in 1991 there are huge inequalities in Britain in the distribution of wealth, with the wealthiest 5% of the people owning 37% of all the marketable wealth; (b) there has been a trend over the century for the inequalities to be reduced to an extent; for example, in 1911-13 the richest 1% owned 69% of all property, whereas in 1960 they owned 42% of all private property.
|
|
|
During the 1980s the UK conservative government instituted a programme of privatisation of state companies, thus making share ownership more available to the public as a whole. In 1970 it is estimated that 7% of adults owned shares; by 1988 this increased to 21%. However, shares are increasingly being owned by institutions rather than by private individuals, and the proportion of shares owned privately fell from 33% in 1979 to 18% in 1989 according to one estimate.
|
|