|
Cost-Benefit Analysis |
Externalities |
|
The price mechanism only achieves productive and allocative (Pareto) efficiency when there is perfect competition and there are no externalities.
|
|
|
We have seen that externalities are costs imposed on, or benefits given to, firms or households which are not parties to the transactions that give rise to these effects.
|
|
|
For example, if a factory pollutes a river, then the cost of that pollution is imposed on the people living downstream of the factory. If there is no other way in which the factory owners are made to pay for the pollution, then the factory is overproducing.
|
|
|
Pollution is an example of a social cost; social costs are also called negative externalities.
|
|
|
Social benefits are benefits from goods and services that the companies producing the goods and services cannot charge for.
|
|
|
An example of a social benefit is an effective private transport system. The company running the system is only able to charge those customers who use it; but the system has benefits in terms of lower traffic congestion on the roads that, for instance, private motorists who do not use the transport system can also enjoy.
|
|
|
This reduction in traffic congestion is an example of a social benefit; social benefits are also called positive externalities.
|
|
Social costs, allocative efficiency and equity |
|
When social costs are not taken into account the result is under-pricing and over-production.
|
|
|
Conversely, when social benefits are external to the market and not subject to a demand schedule determining prices, the result is under-production. Hence, externalities cause production to be not allocatively efficient.
|
|
|
Social costs are also not fair (not “equitable”). This is because costs are imposed on third parties who receive no compensation, and benefits are gained by third parties who make no payment.
|
|
|
In other words, and to sum up, external costs and benefits are both inefficient and unfair.
|
|
Cost-benefit analysis |
|
The central idea behind cost benefit analysis is to extend market analysis to include the externalities.
|
|
|
The private costs that firms face when producing a good are represented in market analysis by the industry (market) supply curve.
|
|
|
The private benefits that firms enjoy when selling a good are represented in market analysis by the market demand curve.
|
|
|
In cost-benefit analysis the market supply curve is called the marginal private cost curve (MPC). The market demand curve is called the marginal private benefit curve (MPBI).
|
|
|
Note the term “marginal” in these expressions. This term means “what you get for one more”. The supply curve is a marginal private cost curve, since it represents the additional cost of producing one more. The demand curve is a marginal private benefit curve, since it represents the additional value (expressed in terms of what someone might want to pay) of selling one more.
|
|
|
In cost-benefit analysis we add to the marginal private costs the marginal external cost, and we add to the marginal private benefit the marginal external benefit.
|
|
|
Both the marginal external costs and benefits are valued in monetary terms, just as the private costs and benefits are. Of course, this is actually the difficult and contentious part of the whole approach since in practice it is very difficult to evaluate social costs and benefits, and an element of subjective judgement is likely to creep in.
|
|
|
For example, when there has been a spillage of oil into the sea which has been carried onto a beech, it is possible to value precisely the cost of the clean-up operation. This is revealed through the bills presented by the firms that undertake the job of cleaning up the beech. However, it is more difficult to evaluate the risk of an oil spillage, and add this estimate to the private costs of an oil shipping company.
|
|
The loss of social benefit from over or under-producing |
|
We have seen that the supply curve for the industry is equal to the marginal private cost. That is, the supply curve just is the marginal cost of producing one more of the good. This gives us
|
|
|
S = MPC
|
|
|
The marginal social cost (MSC) of producing one more of the good arises from adding the marginal private cost (MPC) to the marginal external cost (MXC)
|
|
|
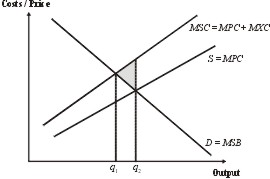
MSC = MPC + MXC
|
|
|
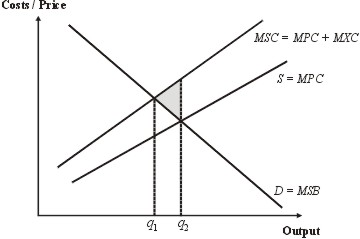
The following graph illustrates the situation where the external costs outweigh the social benefits of the production of a particular good.
|
|
|
|
|
Overproduction accompanied by undercharging
|
|
|
The shaded region represents the loss of benefit to society that results from overproduction and undercharging. The quantity produced is q2 but the level of output that results in the maximum benefit to society is q1.
|
|
|
Let us look at this just a little more closely to make sure that the reason why the shaded region in the above diagram represents the loss of social benefit is properly understood.
|
|
|
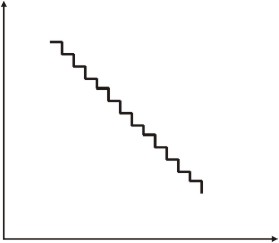
Firstly, let us recall that whilst we draw the lines in these graphs as continuous straight lines, this is for convenience mainly. The lines need not in practice represent linear relationships (that is, straight lines), and, more importantly here, they are not in fact continuous. They represent the price and cost of producing more and more of the good. But the goods are produced on an item-by-item basis. That is, for most goods, you either have produced, for example, ten units, or eleven units, but not a fraction of a good between ten and eleven. So, viewed under a microscope, these demand and cost curves are actually rather like a staircase.
|
|
|
|
|
Marginal social benefit under the microscope
|
|
|
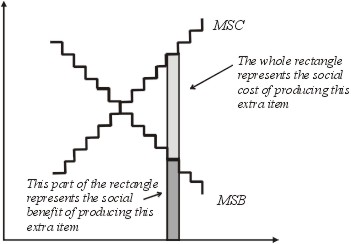
As already indicated the optimum social benefit occurs when the marginal social cost is equal to the marginal social benefit (MSC = MSB). We can now explain why. Suppose the industry is producing at a point where marginal social cost is greater than marginal social benefit.
|
|
|
|
|
Cost of producing one more
|
|
|
As the diagram shows the social cost of producing one more item in this case is greater than the social benefit from producing it; so by producing one less total social benefit will increase.
|
|
|
|
|
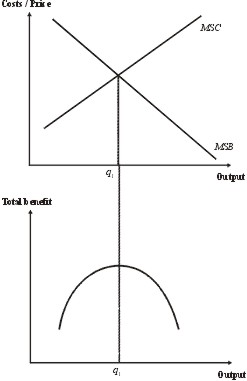
Total benefit has a maximum
|
|
|
Thus, as the following graph indicates when social costs (MXC) are not included, the result is overproduction.
|
|
|
|
|
Overproduction arising from not including social costs
|
|
|
Conversely, when social benefits outweigh social costs, and these are not included in a market analysis, the result is under-production.
|
|
|
The deadweight loss is defined to be the total excess of social cost over social benefit arising from over-production. It is represented graphically by the shaded triangle in the diagram above.
|
|
|
The deadweight loss is an example of market failure — in this case, the market fails to provide the allocatively efficient output because the external costs (and benefits) of the good are not “seen” by the producer.
|
|
|
In conclusion, cost-benefit analysis is a process in which (a) all costs, both private and social, are identified; (b) a value is placed on those costs and benefits in monetary terms; hence (c) the principles of supply and demand analysis can be extended to determine the socially optimum output for any given project or product.
|
|
