|
Graphing functions |
|
|
|
To use the resources of this chapter you must first register |
|
|
CONTENTS |
|
|
ITEM |
|
TYPE |
|
NUMBER |
|
| Making graphs of functions |
|
Workout |
|
51 slides |
|
| Graphing functions |
|
Library |
|
14 questions |
|
|
|
Once you have registered, you can work through the slides one by one.
The workout comprises a series of sides that guide you systematically through the topic concept by concept, skill by skill. The slides may be used with or without the support of a tutor. The methodology is based on problem-solving that advances in logical succession by concept and difficulty. The student is presented with a problem or series of questions, and the next slide presents the fully-worked solution. To use the material you must sign-in or create an account.
blacksacademy.net comprises a complete course in mathematics with resources that are comprehensive.
|
|
|
|
SAMPLE FROM THE WORKOUT |
| Showing American English version |
SLIDE 1 - QUESTION1 |
 |
|
SLIDE 2 - SOLUTION |
 |
|
|
SAMPLE FROM THE LIBRARY |
| Showing American English version |
QUESTION [difficulty 0.1] |
 |
|
SOLUTION |
 |
|
|
DEPENDENCIES |
|
|
|
|
CONCEPTS |
|
|
|
|
LEV. |
|
|
Different representations of a function
|
|
632.3 |
|
|
Giving the rule of a function
|
|
632.4 |
|
|
Integer, rational and real domains of a function
|
|
632.8 |
|
|
Plotting a graph by brute force
|
|
633.0 |
|
|
Implict rules for plotting graphs
|
|
633.2 |
|
|
Straight line graph requires only two points
|
|
633.4 |
|
|
Rationale
|
|
633.6 |
|
|
Finding two points on a line
|
|
633.8 |
|
|
Plotting a parabola
|
|
634.0 |
|
|
Curve
|
|
634.1 |
|
|
Smooth
|
|
634.2 |
|
|
Continuous
|
|
634.3 |
|
|
Properties of the parabola
|
|
634.5 |
|
|
Axis of symmetry - line of reflective symmetry
|
|
634.5 |
|
|
Turning point
|
|
634.5 |
|
|
Maximum
|
|
634.5 |
|
|
Minimum
|
|
634.5 |
|
|
Root
|
|
634.5 |
|
|
Parabola as invariant curve
|
|
636.1 |
|
|
Vertical translation of a parabola
|
|
636.5 |
|
|
Reflection of a parabola in a horizontal line
|
|
636.8 |
|
|
Vertical asymptote
|
|
637.2 |
|
|
Properties of the rectangular hyperbola
|
|
637.4 |
|
|
Anti-symmetry
|
|
637.5 |
|
|
Quadrant
|
|
637.5 |
|
|
Hyperbola as invariant curve
|
|
637.7 |
|
|
Vertical translation of hyperbola
|
|
637.7 |
|
|
Horizontal translation of hyperbola
|
|
638.0 |
|
|
|
|
RAW CONTENT OF THE WORKOUT |
|
| To make use of this chapter, please first register. Then you can work through the slides one by one. |
|
| What is provided here is the raw text of the workout. Most of the information is contained in the image files, which are not included with this text. The text may appear deceptively short. (The content overall of blacksacademy.net is vast.) Any in-line questions appear as a question mark [?]. This text is provided only as an indication of the overall quantity of material contained in the chapter. To use the material you must sign-in or create an account. |
|
| * |
|
|
SLIDE 1
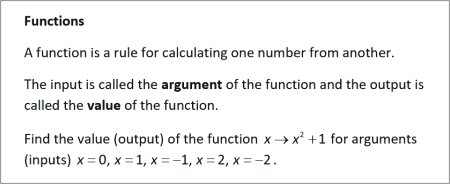
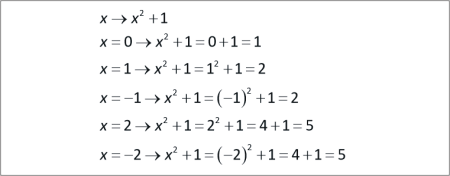
Functions
A function is a rule for calculating one number from another.
The input is called the argument of the function and the output is called the value of the function.
Find the value (output) of the function for arguments (inputs) .
SLIDE 2
SLIDE 3
Different representations of a function
The idea of a function is fundamental in mathematics, and for that reason, we have different ways of communicating the same idea.
We call a function a map or mapping and represent it using an arrow.
“f maps x to y.”
The function is shown above the arrow by a letter, here f. The input argument is at the front of the arrow, and the output value at the end.
“y equals f of x”
Here the process of computing the output value for the input argument is shown by placing the argument inside a bracket. The f, denoting the function, is placed in front of the bracket. Here the bracket does not mean multiplication, but a process of computation. The value comes at the front.
SLIDE 4
Specifying the function by giving the rule
and do not tell you what the function does. They do not give the rule, and show you how to find y given x.
Suppose the rule is “square x and add 1”.
Then we replace f by this rule.
If we are asked the question, “What is f?”, then we write
SLIDE 5
Complete the following
?
?
?
?
?
?
SLIDE 6
?
?
?
?
?
?
SLIDE 7
Consolidation – integers, rational numbers and real numbers
Recall that an integer is a whole counting number, positive and negative. An rational number is a ratio of numbers, positive or negative, like or . This is the same as a fraction. Because there are irrational numbers, we have a collection of all rational and irrational numbers, which is called the set of real numbers, or reals for short.
Real numbers are used in measurements.
SLIDE 8
Functions can take integer, rational and irrational numbers as their arguments.
Compute for the function
? ?
? ?
? ?
? ?
? ?
SLIDE 9
?
?
?
?
?
?
?
?
?
?
SLIDE 10
A graph is a visual representation of what a function does. When plotting a graph by brute force, we find values of the function for different arguments and join up the points.
x -4 -3 -2 -1 0 1 2 3 4
Complete the table for and plot this function.
SLIDE 11
x -4 -3 -2 -1 0 1 2 3 4
-10 -8 -6 -4 -2 0 2 4 6
SLIDE 12
x -4 -3 -2 -1 0 1 2 3 4
-10 -8 -6 -4 -2 0 2 4 6
The graph on the left is the correct graph of . But the graph on the right goes through all the same points that we calculated. How do we know that the graph of is the straight line on the left and not the curvy line on the right?
SLIDE 13
x -4 -3 -2 -1 0 1 2 3 4
-10 -8 -6 -4 -2 0 2 4 6
We know that is a straight line, because in we only ever multiply x by 2, so cannot change as much as the curve in the right-hand graph does. Only the straight-line continues the rule; the second line must use another rule that connects the given points.
SLIDE 14
x -4 -3 -2 -1 0 1 2 3 4
-10 -8 -6 -4 -2 0 2 4 6
To draw the line of we found the coordinates of 9 points.
? What is the minimum number of points you need to know to draw a straight line?
? To draw the line did we do too much work when calculating the coordinates?
SLIDE 15
? To draw a straight line, we need to know only two points. A straight line on a flat surface, such as we take the coordinate plane to be, requires us to know only two points.
x -4 -3 -2 -1 0 1 2 3 4
-10 -8 -6 -4 -2 0 2 4 6
? As we need only two points to draw a straight line, we calculated 7 points too many when we plotted the graph of .
SLIDE 16
A rationale is a justification for doing something. If we knew already that is a straight line and that to draw it we only need to find the coordinates of two points, why then did we bother to find the coordinates of nine points?
What is the rationale for it?
SLIDE 17
Rationale – or why we work harder than it seems we must
The answer, or justification for the extra-work, is that as a student, you need the practice. Later, you will learn methods of drawing or sketching a whole range of curves for given functions, but first you must learn to draw them the hard way by plotting the points. You are likely to find the process of understanding the curve sketching difficult, if you have not already had a bit of practice doing it “the hard way”. You pave the way for the future.
There is another point. We start with functions whose graphs are very well known to us. But at some stage in the future, you will encounter an unknown function. Then drawing the curve of the function will be an essential step in finding out more about the function. By that time, you may have calculators and computers to help you with the process, but you won’t be able to use those either if you haven’t got an idea about how you would do it without those machines.
SLIDE 18
The equations ? and ? represent two lines. Find the coordinates of two points on each line by substituting and into ? and and into ?. Draw the lines onto the coordinate plane and use a graphical method to find the approximate point at which both lines meet.
SLIDE 19
?
?
Point of intersection approximately.
SLIDE 20
x -4 -3 -2 -1 0 1 2 3 4
14
Complete the table for and plot this function.
SLIDE 21
x -4 -3 -2 -1 0 1 2 3 4
14 7 2 -1 -2 -1 2 7 14
SLIDE 22
x -4 -3 -2 -1 0 1 2 3 4
14 7 2 -1 -2 -1 2 7 14
What is wrong with the above graph of ?
SLIDE 23
wrong correct
The wrong graph has been joined with straight lines. The graph of must be a curve. This is because the function varies continuously. So, the graph of is a smooth and continuous curve. Also, the graph cannot just “stop” at 4 and . Like a straight line, it is continuous indefinitely throughout the coordinate plane.
SLIDE 24
The graph of this function is a curve called a parabola. What are the properties of a parabola?
SLIDE 25
A parabola has an axis of symmetry, which is a vertical line about which the two halves, left and right, are mirror images of each other. Here the y-axis is the axis of symmetry. It has a turning point, which is here a minimum of the curve. If the curve cuts the x-axis it has roots where it cuts the axis.
SLIDE 26
The roots of the function are the values of x that make the function equal to 0. This is where the function cuts the x-axis. By solving , find the roots of .
SLIDE 27
SLIDE 28
x -4 -3 -2 -1 0 1 2 3 4
10
Complete the table for and plot this function.
SLIDE 29
x -4 -3 -2 -1 0 1 2 3 4
10 4 0 -2 -2 0 4 10 18
SLIDE 30
roots roots
Compare the graphs of the two functions.
SLIDE 31
roots roots
The graphs are both parabolas. They are the same parabola, except that the position of one has been shifted relative to the other. They both have an axis of symmetry. For the axis of symmetry is the y-axis, . For the axis of symmetry is . The main difference between them is that has been shifted relative to . It has also been shifted downwards slightly.
SLIDE 32
x -4 -3 -2 -1 0 1 2 3 4
18
Complete the table for and plot this function.
SLIDE 33
x -4 -3 -2 -1 0 1 2 3 4
18 11 6 3 2 3 6 11 18
SLIDE 34
Compare the graphs of the two functions.
SLIDE 35
roots no roots
The graphs are the same parabola, excepting one thing only – that that graph of has been shifted upwards relative to the graph of by +4. Otherwise, they are the same – and have the same axis of symmetry. One important difference: while has two roots, has none.
SLIDE 36
x -4 -3 -2 -1 0 1 2 3 4
-14
Complete the table for and plot this function.
SLIDE 37
x -4 -3 -2 -1 0 1 2 3 4
-14 -7 -2 1 2 1 -2 -7 -14
SLIDE 38
Compare the two graphs.
SLIDE 39
no roots roots
The graphs of the two functions are essentially the same parabola, the only difference being that the parabola of is the reflection of the parabola of in the line . While has no roots, has two roots at .
SLIDE 40
For what value of x is the function undefined? Why is it undefined? What name to we give to a point where the function is undefined?
SLIDE 41
The function is undefined for . This is because it is not permitted (and not possible) to divide by 0. We call this point a singularity.
SLIDE 42
x -5 -2 -1
0
1 2 5
Complete the table and plot the graph of . At the singularity where the graph of has a vertical asymptote.
SLIDE 43
x -5 -2 -1
0
1 2 5
SLIDE 44
The graph of is called a rectangular hyperbola or just hyperbola for short. Describe the properties of the hyperbola.
SLIDE 45
The rectangular hyperbola has a rotational symmetry of 180°. If we reflect the positive part in the x-axis and then the y-axis we get the negative part. This property is called anti-symmetry, because it is very close to symmetry. It is also symmetric about the two diagonals shown in the diagram. It has a vertical asymptote at - it gets closer and closer to the positive axis in the positive quadrant and closer and closer to the negative axis in the negative quadrant. It has a horizontal asymptote at .
SLIDE 46
The above shows the graph of . Without computing any points, add to the diagram the graph of .
SLIDE 47
The graph of is the same hyperbola as the graph of , except that it is all shifted upwards by +1.
SLIDE 48
For what value is undefined? What does the graph look like at this point?
SLIDE 49
is undefined for because when the denominator is , and it is not permitted to divide by 0.
SLIDE 50
x -4 -1 0
1
2 6
Complete the table for the function and draw the graph of onto the diagram which shows the graph of .
SLIDE 51
x -4 -1 0
1
2 4
|
|

