|
Graphs of polynomials
SLIDE 1
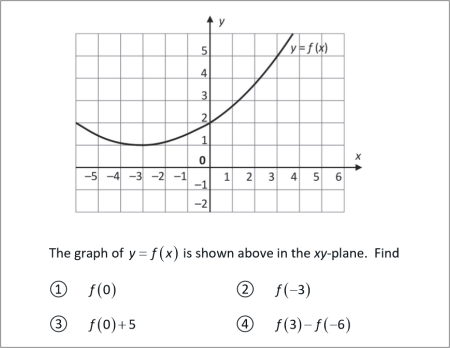
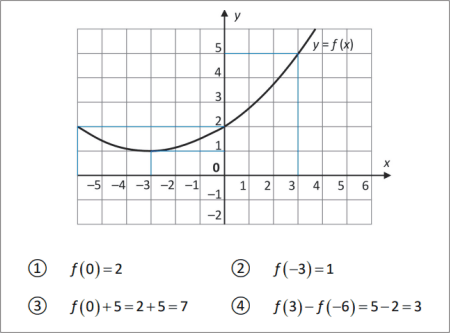
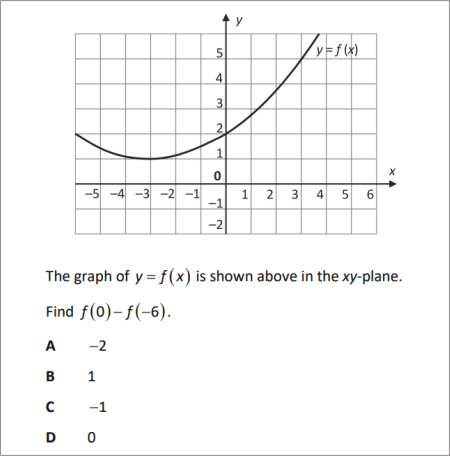
The graph of is shown above in the xy-plane. Find
? ?
? ?
SLIDE 2
? ?
? ?
SLIDE 3
Intercept on the y-axis
The graph of is shown above in the xy-plane. When we have . That is, , where k is a constant. (Any letter may be used.)
SLIDE 4
Find the intercept on the y-axis of the following functions. For each, state also the coordinate of the intercept.
?
?
?
?
SLIDE 5
?
?
?
?
SLIDE 6
The diagram shows the graph of . The graph crosses the y-axis at .
? Find the value of k.
? How does k vary has x changes?
? What is the name that we give to k?
SLIDE 7
?
? k does not vary with x.
k is a constant.
? k is called the intercept on the y-axis.
SLIDE 8
The graph of is shown above. The curve corresponding to the function is a hyperbola (rectangular hyperbola).
What value, if any, does take when . Does have a y-intercept?
SLIDE 9
Singularity
When , is undefined because we cannot divide by zero. This is shown in the graph by a vertical asymptote � the curve gets closer and closer to the y-axis, without ever touching it. A value where a function is undefined is called a singularity. The graph of has also a horizontal asymptote. As x gets larger and larger, the value of gets smaller and smaller, without every becoming zero. The hyperbola gets closer and closer to the x-axis without ever touching it. The x-axis is an asymptote. The function does not have a y-intercept.
SLIDE 10
The graph of is shown in the xy-plane. What are the equations of the ? vertical and ? horizontal asymptotes?
SLIDE 11
? The vertical asymptote is the y-axis, with equation
? The horizontal asymptote is the x-axis, with equation
SLIDE 12
For each of the following (a) find any singularities, (b) state the equation of any vertical asymptotes.
? ?
? ?
SLIDE 13
?
?
?
Adding 2 to just shifts the whole graph up by 2. It does not change the position of the vertical asymptote.
?
This is an equation of a straight line and can be defined for all values of x. It has no singularities.
SLIDE 14
I. For all functions the y-intercept is defined to be the value of .
II. Provided , the y-intercept of the function is the value .
III. In the equation of the straight-line, , a is the gradient and b is the intercept on the y-axis.
Which of the above are true?
A I only
B III only
C I and III only
D II and III only
E I, II and III
SLIDE 15
I. For all functions the y-intercept is defined to be the value of ? This statement is false. For example, the hyperbola is undefined for
II. Provided , the y-intercept of the function is the value ? true
III. In the equation of the straight-line, , a is the gradient and b is the intercept on the y-axis ? true
Solution
D II and III only
SLIDE 16
continuous continuous not continuous
and smooth not smooth not smooth
A curve is continuous if it can be drawn without lifting the �pencil� from the paper.
A continuous curve is smooth if it has no sharp points in it.
A curve with gaps in it is neither continuous nor smooth.
Note. Lines are also regarded as curves. (All lines are curves, not all curves are lines.)
SLIDE 17
Classify the above curves as either (a) continuous and smooth, or (b) continuous but not smooth, or (c) neither continuous nor smooth.
SLIDE 18
? Continuous, not smooth ? Continuous and smooth
? Neither continuous nor smooth
? Continuous and smooth ? Continuous, not smooth
? Continuous and smooth
SLIDE 19
everywhere continuous continuous
continuous and smooth and smooth
and smooth except at the except at the
points highlighted the gaps
Observation
Many curves that are not everywhere smooth and continuous are made up of �small pieces� that are smooth and continuous. They have single, isolated points or gaps where they cease to be either smooth or continuous, or both.
Advanced
There exist curves that are nowhere continuous.
SLIDE 20
Tangent
tangent well-defined at P no tangent at Q
A tangent at a point is the line that just touches the curve at that point.
If a curve is continuous and smooth at a point, then it has a well-defined tangent at that point.
A tangent is a line, so has an equation of the form where m is the gradient and c is the intercept on the y axis.
A tangent is a linear function of the form .
SLIDE 21
The diagram shows the graph of a function. Using a graphical method, find the equation of the tangent to the curve when giving your coefficients to a suitable degree of accuracy.
SLIDE 22
The gradient is . The intercept is . Substituting into , the equation of the tangent is .
The method is clearly not exact. The accuracy is limited by the accuracy of the fitting of the tangent to the curve. A suitable degree of accuracy is 2 significant figures, not more.
SLIDE 23
Turning points
The diagram shows the graph of a function .
Points where the gradient of the tangent to a curve is 0 are called turning points. Since tangents are lines, they have equations . When the gradient is 0, we have , and equation .
There are three kinds of turning points: a minimum, a maximum and a point of inflection.
Minimum and maximum are abbreviated by min and max.
SLIDE 24
Local min, local max
Strictly, a minimum is a local minimum because elsewhere the value of may be less than at the minimum; there may also be more than one minimum, if a curve has many turning points.
They are local because it is only in the region around the turning point that the minimum or maximum is found.
Generally, it is always understood that turning points occur locally, so the expression �local� is dropped. Just as we call a rectangular hyperbola just a �hyperbola�, so we call a local minimum a �minimum�.
SLIDE 25
-5 -8
-4 -6
-3 -4
-2 -2
-1 0
0 2
1 4
2 6
3 8
4 10
5 12
The complete graph of a function and a table of values for a second function is shown above. The maximum value of is k and the minimum value is j. What is the value of ?
SLIDE 26
-5 -8
-4 -6
-3 -4
-2 -2
-1 0
0 2
1 4
2 6
3 8
4 10
5 12
The maximum of lies at , and .
The minimum of lies at , and .
SLIDE 27
Roots, factors
The function cuts the x-axis where , and (only). The roots of are . The factors of are , and .
The argument of a function such that is called a root of the function. Any root of a function corresponds to a factor of the function, .
Another name for a root is a zero. The zeros of a function are the values of x that make .
SLIDE 28
Factorise the quadratic function .
Find the factors and roots of .
Find the coordinates of the minimum of , and the y-intercept. Sketch the graph of .
SLIDE 29
. The factors are and . The roots are and .
The axis of symmetry is at .
The minimum value is .
The minimum is . The y-intercept is .
SLIDE 30
Polynomials
A polynomial is any finite expression that involves only positive integer powers of a variable, such as x.
Examples
The individual terms of polynomials are called polynomial terms. For example, .
Advanced
Expressions involving a root symbol (if it cannot be eliminated) are not polynomials. For example, . These are called radicals.
Expressions involving a negative index are not polynomials. For example, . These are called rational expressions.
Expressions involving a trigonometric expression (if it cannot be eliminated) are not polynomials. Examples, . These are transcendental expressions.
SLIDE 31
Classify the following as polynomials or not polynomials.
? ?
? ?
? ?
? ?
SLIDE 32
?
?
?
?
?
?
?
?
SLIDE 33
A polynomial function is a function that equates to a finite polynomial.
Examples
Any function that does not equate to a finite polynomial is not a polynomial function.
SLIDE 34
Classify the following as polynomials functions or not polynomial functions.
? ?
? ?
? ?
? ?
SLIDE 35
?
?
?
?
?
?
?
?
SLIDE 36
Degree of a polynomial
The degree of a polynomial (expression or function) is the highest positive number in the exponent (index).
The degree of is 3, because the highest power of x is in , which is 3.
It is usual to write polynomial expressions or functions in descending powers. But this is not necessary. is a polynomial function of degree 3.
SLIDE 37
What is the degree of each of the following?
?
?
?
?
SLIDE 38
?
?
?
?
SLIDE 39
Names of polynomial functions
Polynomial functions are named after their degree. In the table that follows a, b, c, d and k are constants, meaning, just numbers.
Polynomial function Example Degree Name
0 constant
1 linear
2 quadratic
3 cubic
degree 4 ? quartics degree 5 ? quintics
SLIDE 40
Name the following polynomial functions
? ?
? ?
? ?
SLIDE 41
?
?
?
?
?
?
SLIDE 42
Properties of polynomial functions
All polynomial functions
? define continuous and smooth curves
? have at most one less turning point than degree
Example
The cubic polynomial has degree 3. Therefore, it has at most 2 turning points.
Note. Polynomial functions can have no turning points.
? If the graph has more than one turning point, then max and min alternate (one is followed by the other).
Exception. A max or min can be followed by a number of points of inflection.
SLIDE 43
Which of the following could be the graph of a polynomial function?
SLIDE 44
? Cannot be a polynomial function. Not smooth.
? Could be a polynomial function.
? Cannot be a polynomial function. Not continuous
? Could be a polynomial function.
? Cannot be a polynomial function. Not continuous. Min followed by min.
? Could be a (linear) polynomial function. (A straight line.)
SLIDE 45
Example
Given that , sketch the cubic function that has zeros at .
Solution
As the function is cubic (degree 3), it has at most 2 turning points. As , it must pass through the point . As it has zeros (roots) at , it must cross the x-axis at , and . Therefore, a max must lie in the interval , and a min must lie in the interval . This information enables us to sketch the curve.
**
SLIDE 46
Given that , sketch the cubic function that has zeros at .
SLIDE 47
Given that , sketch the cubic function that has zeros at .
Solution
As the function is cubic (degree 3), it has at most 2 turning points. As , it must pass through the point . As it has zeros (roots) at , it must cross the x-axis at , and . Therefore, a max must lie in the interval , and a min must lie in the interval .
SLIDE 48
From factors to roots (zeros)
Sketch the graph of the cubic function
Solution
As , when we have either
So, the roots (zeros) lie at . We need to know one more point through which passes. We test a point. For , . So, passes through the point .
SLIDE 49
Sketch the graph of the cubic function
SLIDE 50
Sketch the graph of the cubic function
Solution
So, the roots (zeros) lie at . We need to know one more point through which passes; for example, whether lies below or above the x-axis when . We test a point. For , . So, passes through the point , which is its y-intercept.
SLIDE 51
Sketch the graph of the cubic function
SLIDE 52
Sketch the graph of the cubic function
Solution
In the factor is the reverse of . Hence, also, , so we expect the graph of to start above the x-axis, not below it, as in the previous examples. The process of finding roots and testing a point are the same as before.
So, the roots (zeros) lie at . For , .
So, passes through the point .
SLIDE 53
The graph of the function is a parabola in the xy-plane. Which of the following intervals contains the x-coordinate of the vertex of the graph of ?
A
B
C
D
E
SLIDE 54
is a parabola in the xy-plane.
The zeros are at and the y-intercept is at . Though we do not need to know it to answer the question, the parabola has axis of symmetry at . It has a minimum in the interval , so the answer is B.
SLIDE 55
A cubic function is defined by
Which of the following intervals contains the x-coordinate of the minimum of the graph of ?
A
B
C
D
E
SLIDE 56
has roots (zeros) at . Since the intercept of on the y-axis is . The minimum lies in the interval . The answer is C.
SLIDE 57
A function is defined by where a, b, c and d are constants. The function has roots and 4. Which of the following are factors of ? More than one answer is possible.
none of these
SLIDE 58
A function is defined by where a, b, c and d are constants. The function has roots and 4. Find the factors.
Solution
The factors of a function correspond to the roots
This is because the root is the solution the equation
Hence, in this question
root factor
SLIDE 59
A function is defined by where a, b, c and d are constants. The function has roots and 2. Write as a product of its factors.
SLIDE 60
A function is defined by where a, b, c and d are constants. The function has roots and 2. Write as a product of its factors. (Do not attempt to find a, b, c and d.)
Solution
root factor
SLIDE 61
What are the factor(s) of ? Given that this function has one turning-point, what kind of turning point(s) does have? Sketch the graph of .
SLIDE 62
What are the factor(s) of ? Given that this function has one turning-point, what kind of turning point(s) does have?
Solution
The roots (zeros) of a function are the value(s) of x that make . Thus, there is a root at corresponding to a factor . Although there is only one value that makes , it is often helpful (and more correct) to say that has one root repeated 3 times. We can write this . To sketch the graph of we observe that it is negative when x is negative and positive when x is positive. The negative part of the graph of is a rotated copy of the positive part. As we are told that it has one turning point, since it has no max or min, then at 0 (the root) it has a point of inflection.
SLIDE 63
Write the functions and as products of their factors.
SLIDE 64
The zeros of and correspond to factors , and . Hence, .
The zeros of and correspond to factors , and . takes negative values for and hence starts in the upper quadrant with a negative gradient. Hence, we must introduce a minus sign.
We can take the minus sign inside one (only) of the factors, to obtain, for example, .
SLIDE 65
where k is a positive integer. Which of the following could be a sketch of the graph of ?
SLIDE 66
where k is a positive integer. Which of the following could be a sketch of the graph of ?
Solution
The roots are at and where . Since then there is a positive root at . Since leads with a negative coefficient, it must have a maximum. The answer is option C.
|